> ## Documentation Index
> Fetch the complete documentation index at: https://help.fieldpulse.com/llms.txt
> Use this file to discover all available pages before exploring further.
# How to Create Inventory Reports
> Build an inventory report in FieldPulse to see the stock you carry by supplier, hub, tag, and unit cost, and what your on-hand inventory is worth.
> **Who uses this:** Admins have full reporting access, and Team Managers can be given it. Service Agents and Limited Agents do not have reporting access. **Availability:** All regions.
You build an inventory report from the **Invoices > Inventory** tab in reporting, and it pulls the items you stock — with supplier, unit cost, unit price, tags, and the quantity held at each hub — into one table. Two common versions of it are inventory by supplier and inventory items by hub.
## Overview
An inventory report answers one question about your stock — what you carry, and what it is worth. The report lists each inventory line item with its cost and price, the supplier it is linked to, the tags on it, and the quantity held in each inventory hub.
Building an inventory report follows the same path as every other raw data report — set a date range, choose the columns, set the filters, then read the table. Inventory reporting is part of [FieldPulse's dashboards and reporting](https://www.fieldpulse.com/features/dashboards-and-reporting). For the parts of the reporting flow that are the same on every record type — saving a report, adding it to your dashboard, and exporting to CSV — see [How to Use Raw Data Reporting](/reporting/raw-data/using-raw-data-reporting).
The inventory report has siblings on nearby tabs. [How to Create Inventory Count Reports](/reporting/raw-data/inventory-count-reports) compares last counts against expected counts and values. [How to Create Inventory Audit Reports](/reporting/raw-data/inventory-audit-reports) tracks inventory changes, so you can see who changed stock and when. [How to Create Item Usage Reports](/reporting/raw-data/item-usage-reports) reports on item quantity, total cost, and total price by item, job, or customer. [How to Create Serialized Inventory Reports](/reporting/raw-data/serialized-inventory-reports) reports on serialized inventory data such as serial number, unit cost, and item name.
## Video walkthrough
## Before you begin
* Add the items you stock to your item list. See [Setting Up Item List & Inventory](/inventory-materials/item-list/adding-items).
* Check that your role has reporting access. An Admin has full reporting access; a Team Manager needs **Full Reporting access** turned on.
## Set the date range
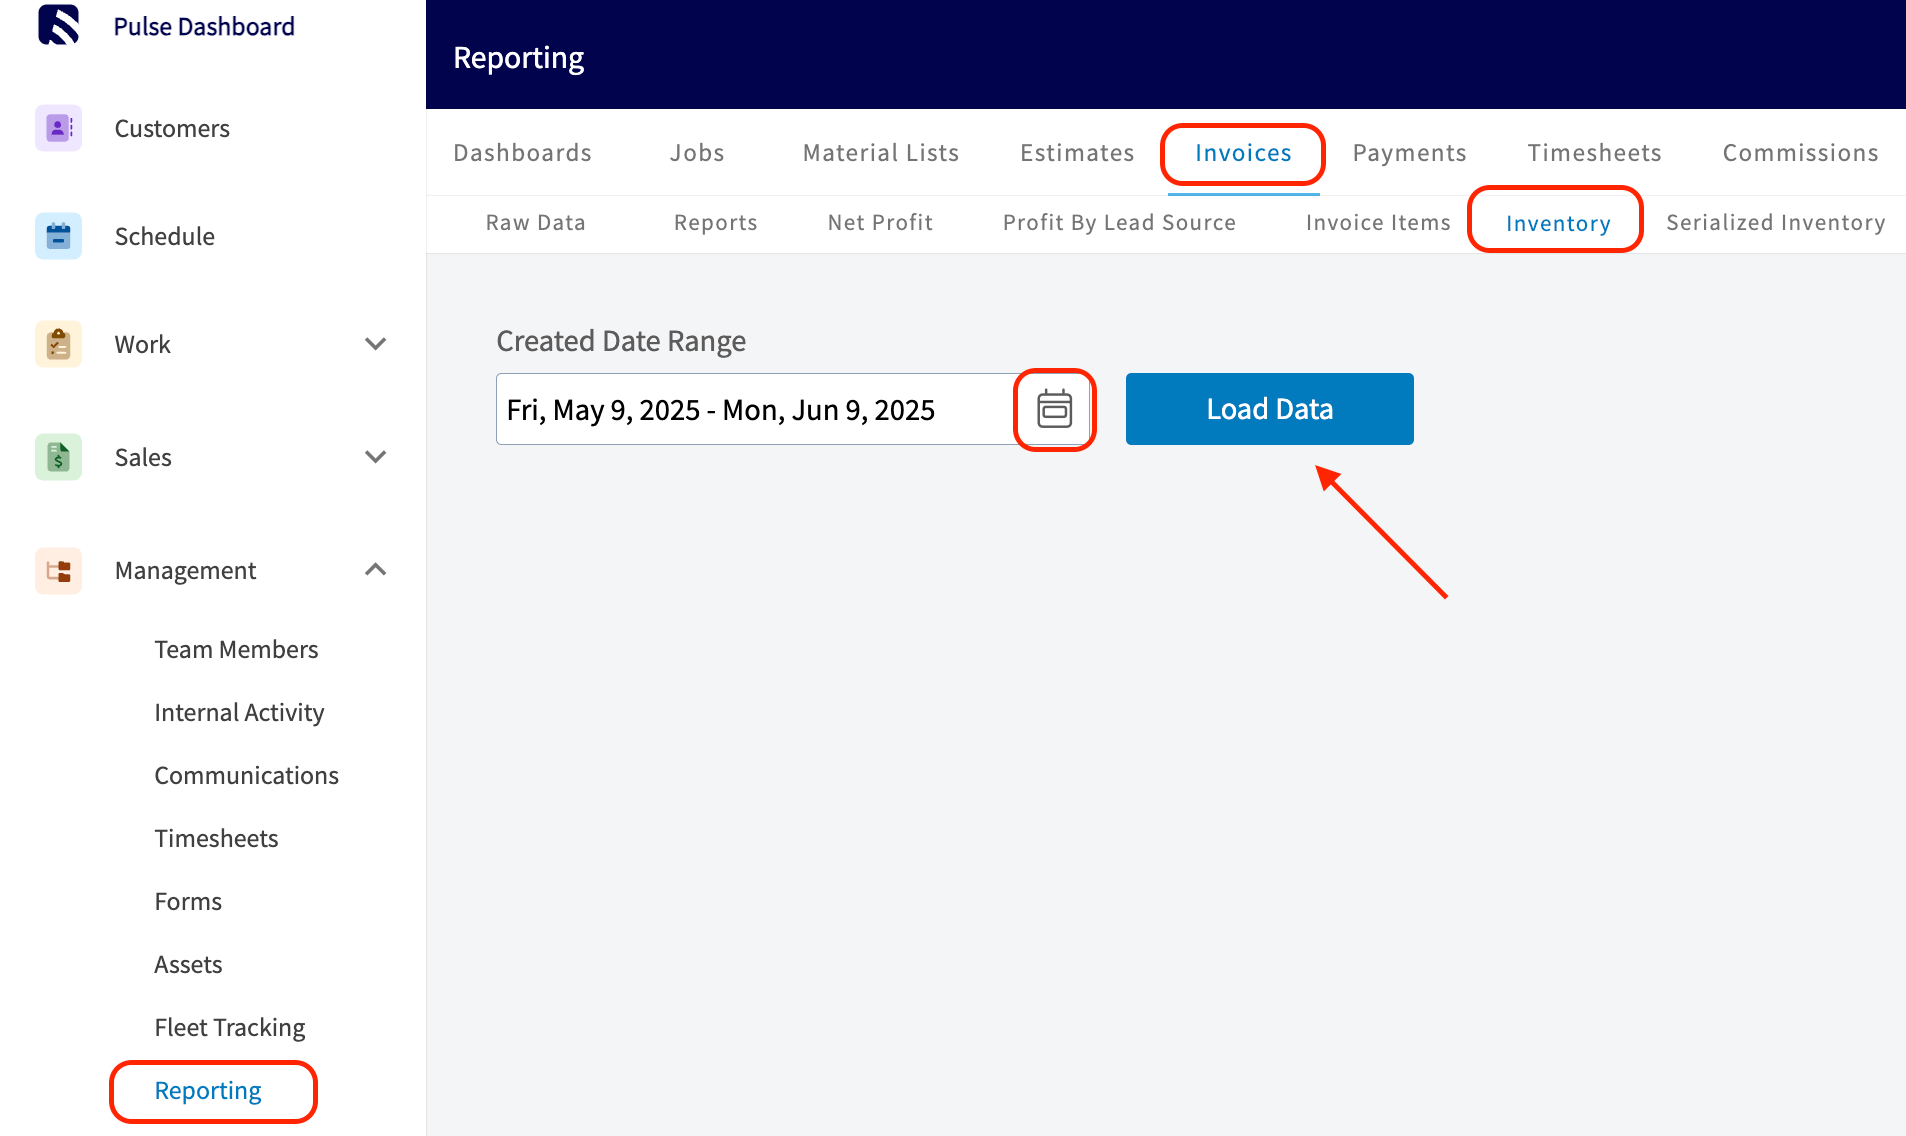
1. Select **Reporting** under the **Management** tab in the left-side menu.
2. Select the **Invoices** tab, then select **Inventory**.
3. Select the calendar icon next to **Created Date Range** and choose the date range you want to report on.
4. Select **Load Data**.
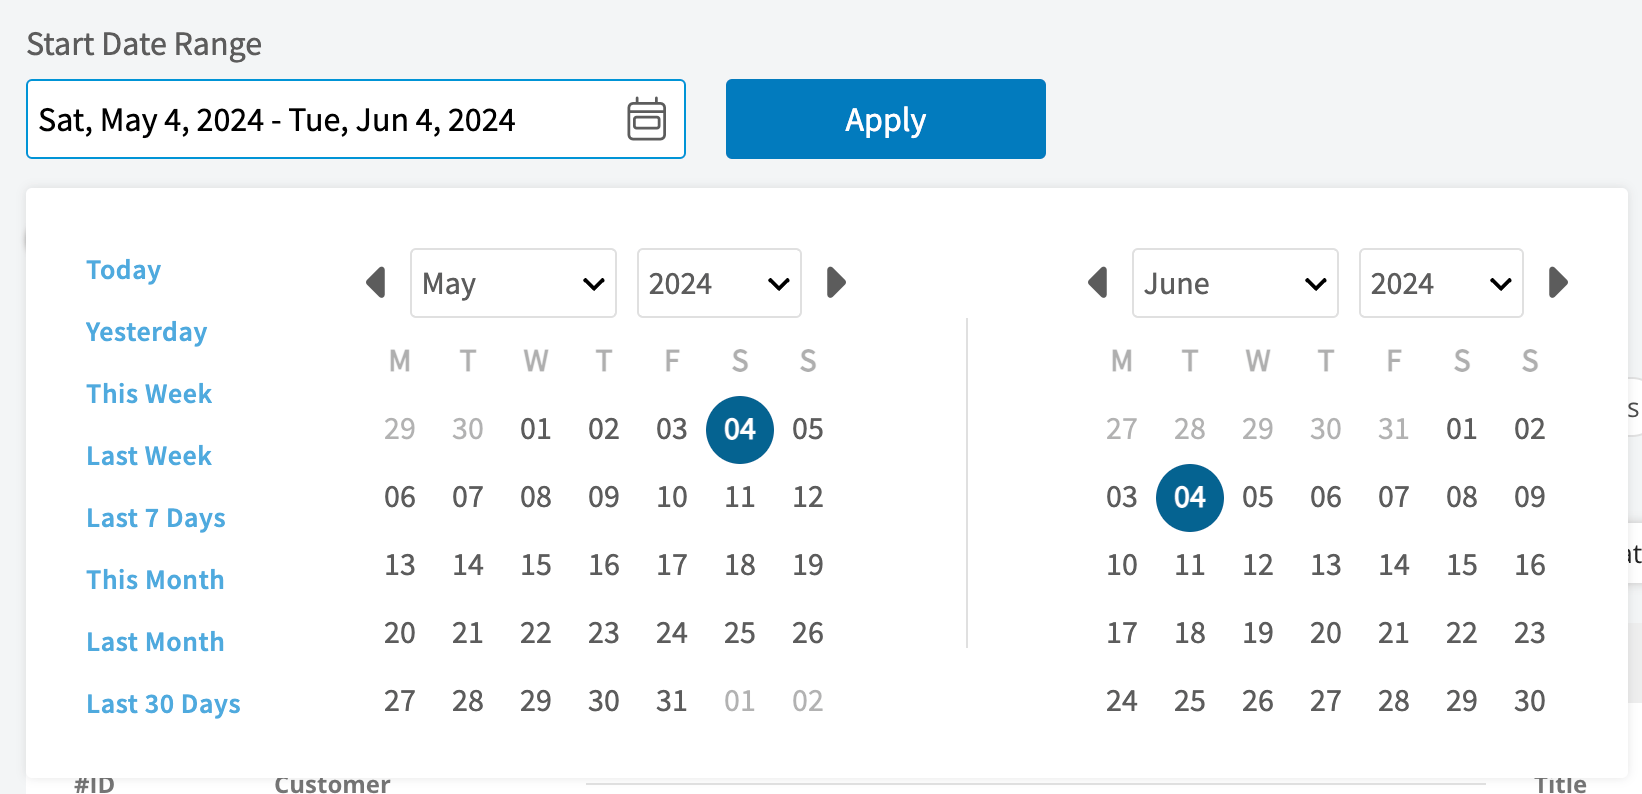 The calendar offers these presets:
| **Preset** | **Date range** |
| - | - |
| **Today** | 12:00 AM to the current time |
| **Yesterday** | The previous day, 12:00 AM to 11:59 PM |
| **This Week** | Monday through Sunday of the current week |
| **Last Week** | The previous week |
| **Last 7 Days** | The previous seven days, including today |
| **This Month** | The first of the current month to the current day |
| **Last Month** | The entire month before the current month |
| **Last 30 Days** | The previous 30 days, including today |
| **Custom** | Start and end dates you select on the calendar |
## Choose your columns
Select **Columns** to choose which inventory fields appear in the report table and the order they appear in.
The calendar offers these presets:
| **Preset** | **Date range** |
| - | - |
| **Today** | 12:00 AM to the current time |
| **Yesterday** | The previous day, 12:00 AM to 11:59 PM |
| **This Week** | Monday through Sunday of the current week |
| **Last Week** | The previous week |
| **Last 7 Days** | The previous seven days, including today |
| **This Month** | The first of the current month to the current day |
| **Last Month** | The entire month before the current month |
| **Last 30 Days** | The previous 30 days, including today |
| **Custom** | Start and end dates you select on the calendar |
## Choose your columns
Select **Columns** to choose which inventory fields appear in the report table and the order they appear in.
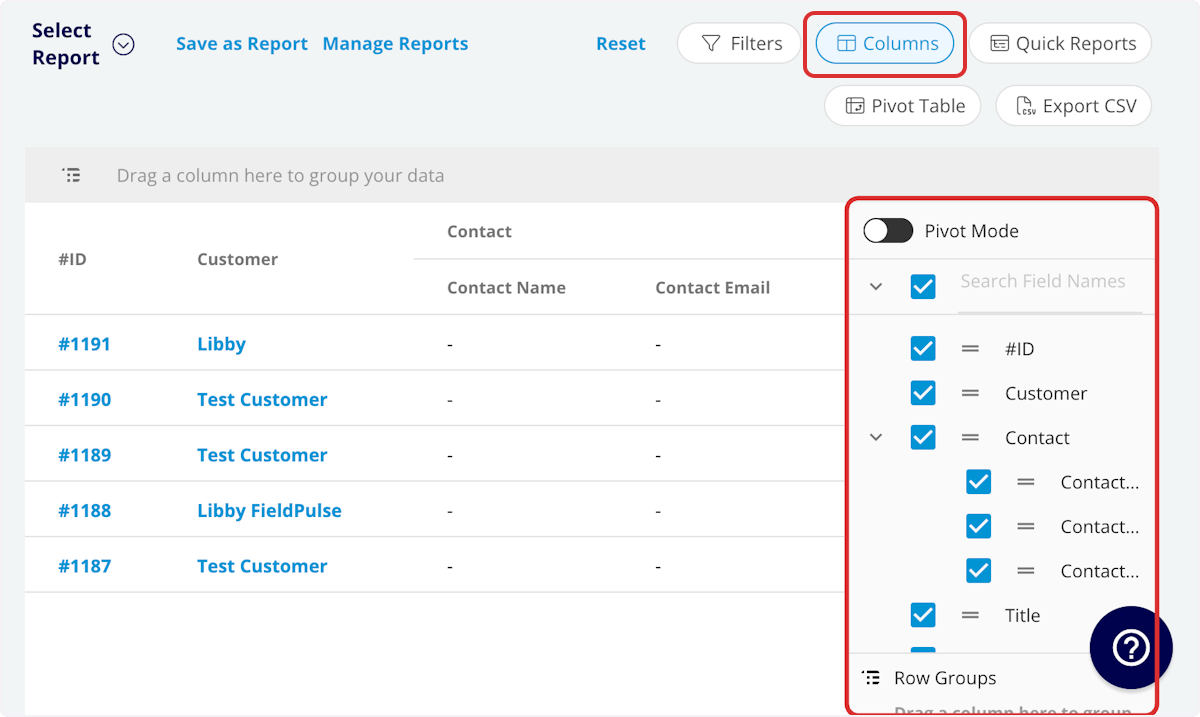 The inventory report includes these columns by default:
| **Column** | **What it holds** |
| - | - |
| **Item Name** | Line item name |
| **Description** | Line item description |
| **SKU** | Item #/SKU |
| **Type** | Product - Inventory |
| **Unit Cost** | Unit cost |
| **Unit Price** | Unit price |
| **Quantity** | Default quantity |
| **UPC** | UPC/barcode |
| **Tags** | Tags on the line item |
| **Created At** | Date and time the line item was created |
| **Supplier Name** | Linked supplier |
| **Hub Name(s)** | Quantity stored at each hub |
## Set your filters
Before running the report, set filters to narrow the results. Select the **Filters** icon, then choose how you want to filter the report.
The inventory report includes these columns by default:
| **Column** | **What it holds** |
| - | - |
| **Item Name** | Line item name |
| **Description** | Line item description |
| **SKU** | Item #/SKU |
| **Type** | Product - Inventory |
| **Unit Cost** | Unit cost |
| **Unit Price** | Unit price |
| **Quantity** | Default quantity |
| **UPC** | UPC/barcode |
| **Tags** | Tags on the line item |
| **Created At** | Date and time the line item was created |
| **Supplier Name** | Linked supplier |
| **Hub Name(s)** | Quantity stored at each hub |
## Set your filters
Before running the report, set filters to narrow the results. Select the **Filters** icon, then choose how you want to filter the report.
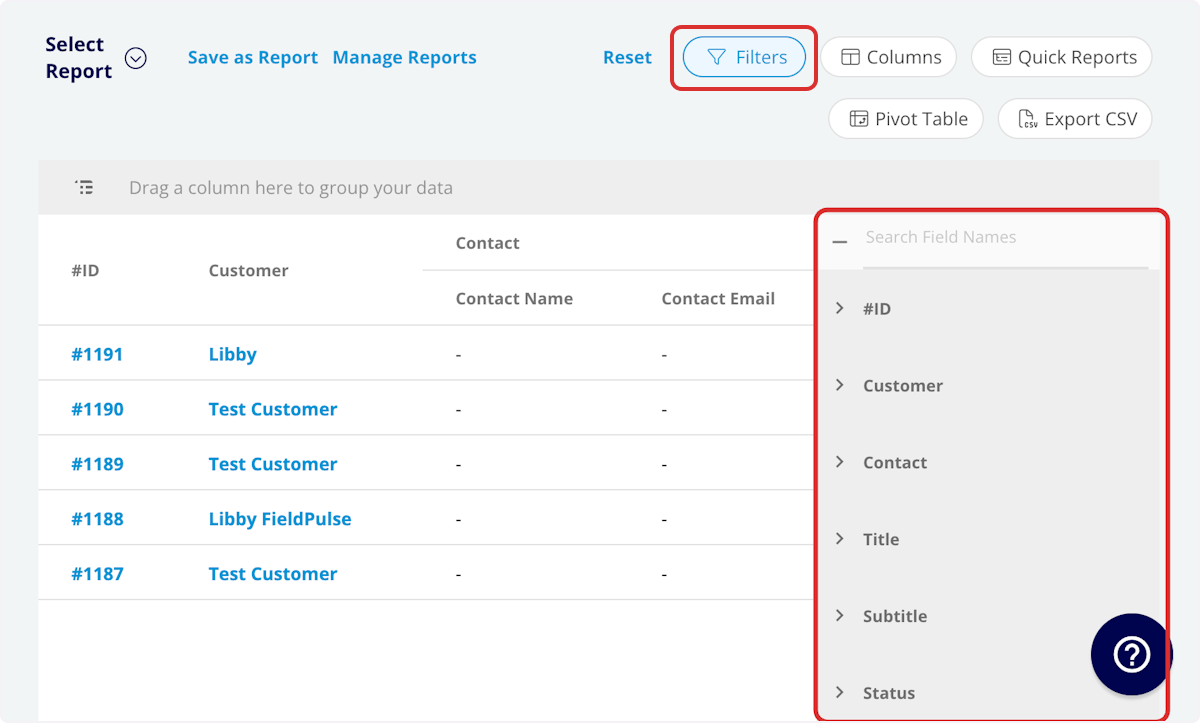 You can filter an inventory report on **Item Name**, **Description**, **SKU**, **Type**, **Tags**, **Supplier Name**, and **Hub Name(s)** by contents, and on **Created At** by date.
### Filter operators
When you filter by contents, choose an operator and then enter the values to filter the data on.
| **Operator** | **Retrieves data** | **Example** | **Data retrieved** |
| - | - | - | - |
| Equals | Equal to a specified value | Supplier Name - Equals Acme Supply | For all items from Acme Supply only |
| Not Equal | Different from a specified value | Tags - Not Equal to HVAC | For all items except those using the HVAC tag |
| Less Than | Lower than a specified value | Unit Cost - Less than 10 | For all items with a unit cost under \$10 |
| Less Than or Equal To | Lower than or equal to a specified value | Created At - Less than or equal to 12/13/2023 | For all items created on or before 12/13/2023 |
| Greater Than | Greater than a specified value | Unit Price - Greater than 500 | For all items with a unit price over \$500 |
| Greater Than or Equal To | Greater than or equal to a specified value | Created At - Greater than or equal to 1/1/2024 | For all items created on or after 1/1/2024 |
| In Range | Including and between two specified values | Unit Cost - Between 100 and 500 | For all items with a unit cost between \$100 and \$500 |
| Starts With | Begins with a specified value | SKU - AC | For all items whose SKU begins with AC |
| Ends With | Ends with a specified value | Item Name - Kit | For all items whose name ends with Kit |
| Blank | No values are in the field | Supplier Name | For all items with no linked supplier |
| Not Blank | Values in the field | Description | For all items with values in the description field |
## Common inventory reports
### Inventory by supplier
Use this report to view all inventory sorted by the linked supplier.
* **Columns:** customize to your needs, but include **Item Name** and **Supplier Name**.
* **Group by:** **Supplier Name**.
### Inventory items by hub
Use this report to see how stock is split across locations. Include the **Hub Name(s)** column, which holds the quantity stored at each hub. For more on the hubs themselves, see [Inventory Hubs Overview](/inventory-materials/item-list/inventory-hubs).
Your inventory report is working when the table returns the items you stock for the date range you set, shows the supplier, cost, and hub columns you selected, and narrows to the items you care about once your filters are applied.
## FAQs
**Is there a way to view the inventory assigned to each technician's van?**
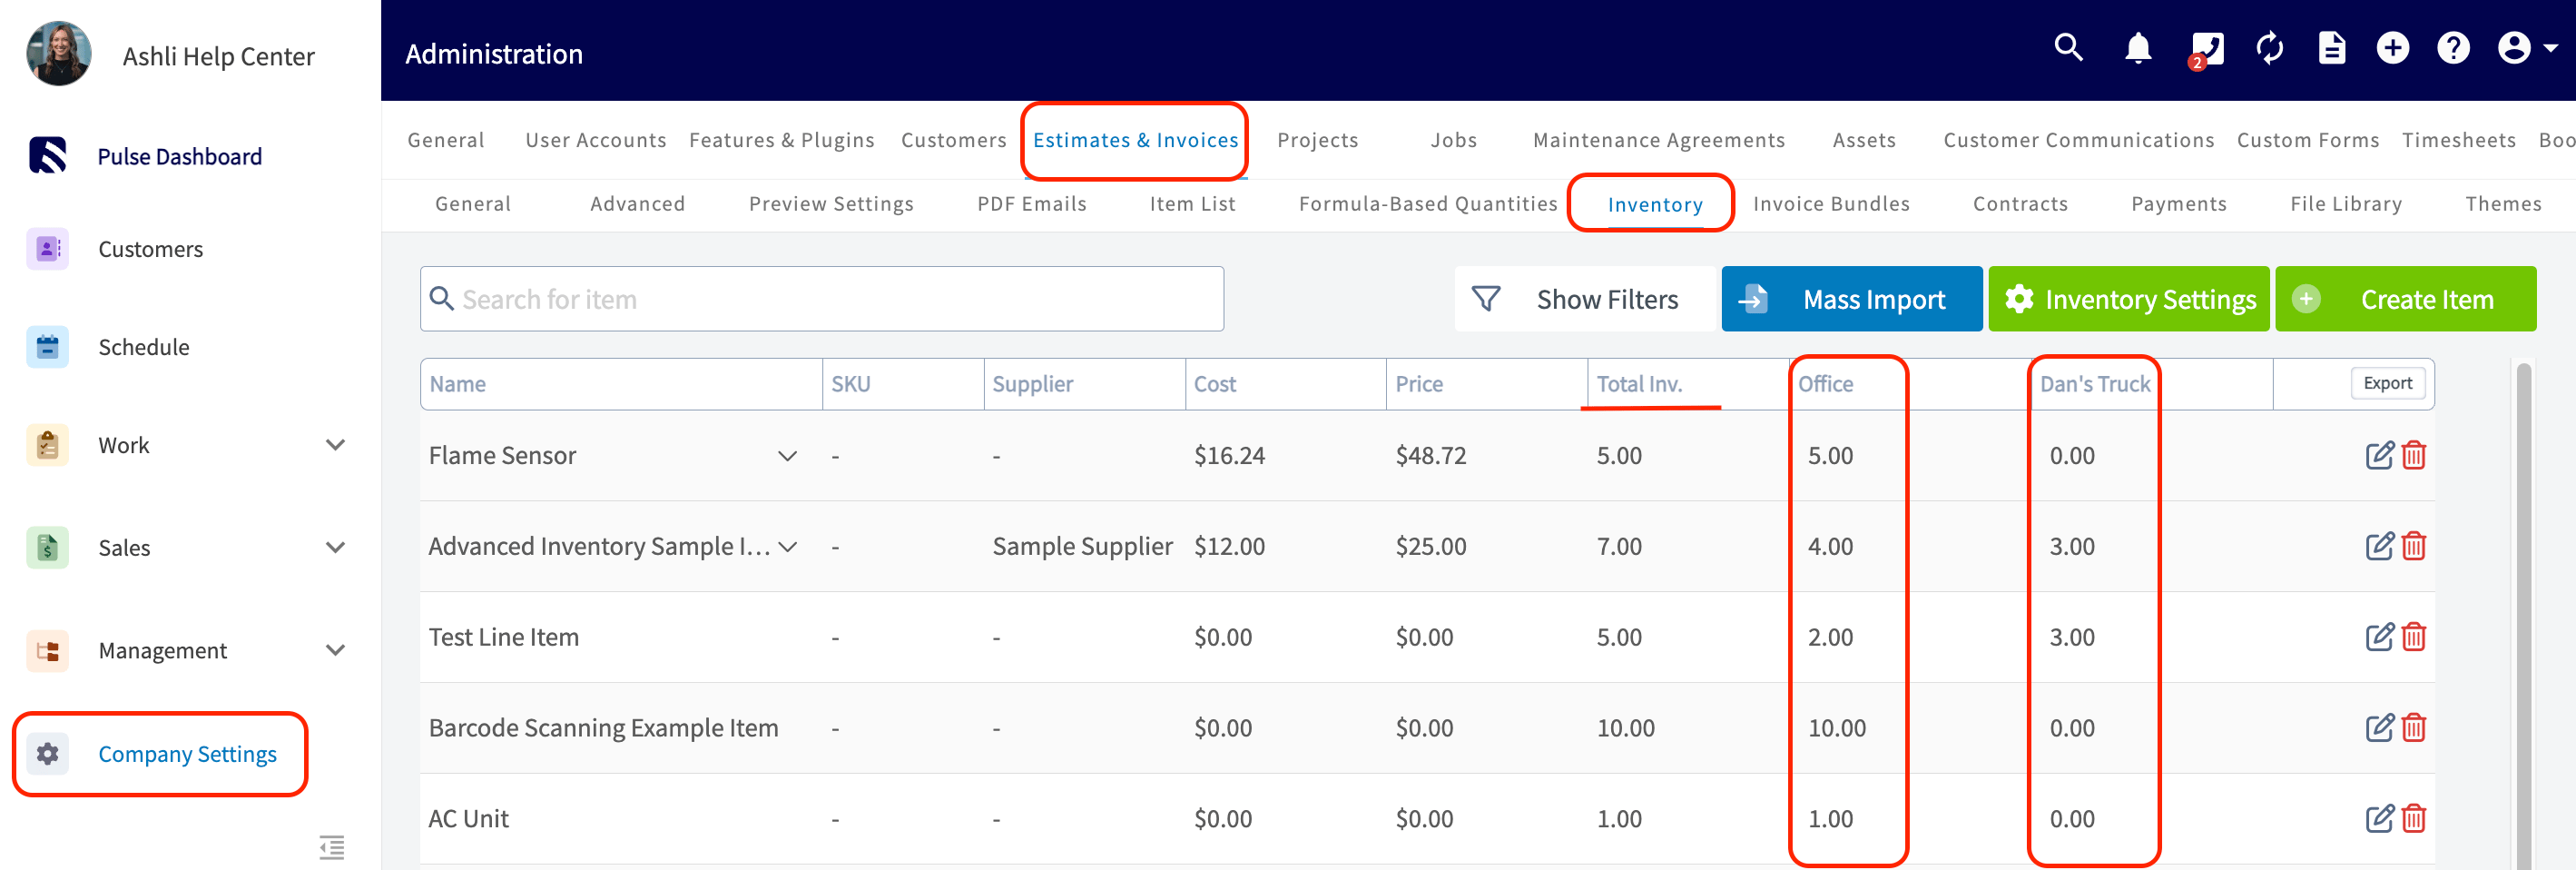
Yes. Go to **Company Settings > Estimates & Invoices > Inventory**, where hub quantities appear as their own columns next to **Total Inv.** You can also read the same split in an inventory report through the **Hub Name(s)** column.
You can filter an inventory report on **Item Name**, **Description**, **SKU**, **Type**, **Tags**, **Supplier Name**, and **Hub Name(s)** by contents, and on **Created At** by date.
### Filter operators
When you filter by contents, choose an operator and then enter the values to filter the data on.
| **Operator** | **Retrieves data** | **Example** | **Data retrieved** |
| - | - | - | - |
| Equals | Equal to a specified value | Supplier Name - Equals Acme Supply | For all items from Acme Supply only |
| Not Equal | Different from a specified value | Tags - Not Equal to HVAC | For all items except those using the HVAC tag |
| Less Than | Lower than a specified value | Unit Cost - Less than 10 | For all items with a unit cost under \$10 |
| Less Than or Equal To | Lower than or equal to a specified value | Created At - Less than or equal to 12/13/2023 | For all items created on or before 12/13/2023 |
| Greater Than | Greater than a specified value | Unit Price - Greater than 500 | For all items with a unit price over \$500 |
| Greater Than or Equal To | Greater than or equal to a specified value | Created At - Greater than or equal to 1/1/2024 | For all items created on or after 1/1/2024 |
| In Range | Including and between two specified values | Unit Cost - Between 100 and 500 | For all items with a unit cost between \$100 and \$500 |
| Starts With | Begins with a specified value | SKU - AC | For all items whose SKU begins with AC |
| Ends With | Ends with a specified value | Item Name - Kit | For all items whose name ends with Kit |
| Blank | No values are in the field | Supplier Name | For all items with no linked supplier |
| Not Blank | Values in the field | Description | For all items with values in the description field |
## Common inventory reports
### Inventory by supplier
Use this report to view all inventory sorted by the linked supplier.
* **Columns:** customize to your needs, but include **Item Name** and **Supplier Name**.
* **Group by:** **Supplier Name**.
### Inventory items by hub
Use this report to see how stock is split across locations. Include the **Hub Name(s)** column, which holds the quantity stored at each hub. For more on the hubs themselves, see [Inventory Hubs Overview](/inventory-materials/item-list/inventory-hubs).
Your inventory report is working when the table returns the items you stock for the date range you set, shows the supplier, cost, and hub columns you selected, and narrows to the items you care about once your filters are applied.
## FAQs
**Is there a way to view the inventory assigned to each technician's van?**
Yes. Go to **Company Settings > Estimates & Invoices > Inventory**, where hub quantities appear as their own columns next to **Total Inv.** You can also read the same split in an inventory report through the **Hub Name(s)** column.
 **Can I save an inventory report to use again?**
Yes. Select **Save as Report**, then **Save as New** to store it under **Select Report**, or **Save as Widget** to add it to your Pulse Dashboard. See [How to Use Raw Data Reporting](/reporting/raw-data/using-raw-data-reporting) for the full saving flow.
**Can I export an inventory report to a spreadsheet?**
Yes. Select **Export CSV** to download the report currently on your screen as a CSV file to your device.
## Related articles
* [How to Use Raw Data Reporting](/reporting/raw-data/using-raw-data-reporting)
* [Setting Up Item List & Inventory](/inventory-materials/item-list/adding-items)
* [Inventory Hubs Overview](/inventory-materials/item-list/inventory-hubs)
* [How to Create Inventory Count Reports](/reporting/raw-data/inventory-count-reports)
* [How to Create Inventory Audit Reports](/reporting/raw-data/inventory-audit-reports)
* [How to Create Serialized Inventory Reports](/reporting/raw-data/serialized-inventory-reports)
## Related topics
- [How to Create Inventory Audit Reports](/reporting/raw-data/inventory-audit-reports.md)
- [How to Create Serialized Inventory Reports](/reporting/raw-data/serialized-inventory-reports.md)
- [How to Create Inventory Count Reports](/reporting/raw-data/inventory-count-reports.md)
- [How to Create Item Usage Reports](/reporting/raw-data/item-usage-reports.md)
This documentation is built and hosted on [Mintlify](https://mintlify.com), a developer documentation platform.
**Can I save an inventory report to use again?**
Yes. Select **Save as Report**, then **Save as New** to store it under **Select Report**, or **Save as Widget** to add it to your Pulse Dashboard. See [How to Use Raw Data Reporting](/reporting/raw-data/using-raw-data-reporting) for the full saving flow.
**Can I export an inventory report to a spreadsheet?**
Yes. Select **Export CSV** to download the report currently on your screen as a CSV file to your device.
## Related articles
* [How to Use Raw Data Reporting](/reporting/raw-data/using-raw-data-reporting)
* [Setting Up Item List & Inventory](/inventory-materials/item-list/adding-items)
* [Inventory Hubs Overview](/inventory-materials/item-list/inventory-hubs)
* [How to Create Inventory Count Reports](/reporting/raw-data/inventory-count-reports)
* [How to Create Inventory Audit Reports](/reporting/raw-data/inventory-audit-reports)
* [How to Create Serialized Inventory Reports](/reporting/raw-data/serialized-inventory-reports)
## Related topics
- [How to Create Inventory Audit Reports](/reporting/raw-data/inventory-audit-reports.md)
- [How to Create Serialized Inventory Reports](/reporting/raw-data/serialized-inventory-reports.md)
- [How to Create Inventory Count Reports](/reporting/raw-data/inventory-count-reports.md)
- [How to Create Item Usage Reports](/reporting/raw-data/item-usage-reports.md)
This documentation is built and hosted on [Mintlify](https://mintlify.com), a developer documentation platform.